The miners who power the Bitcoin network, and are still largely incentivized to do so via the printing of new BTC tokens, are benefitting from an uptick in daily network fees, according to data provided by crypto analytics firm Glassnode. At present the Bitcoin network rewards its miners with 6.25 Bitcoins for every block that it mined (about every 10 minutes), though the Bitcoin network also charges a small fee for transactions, which also goes towards miners.

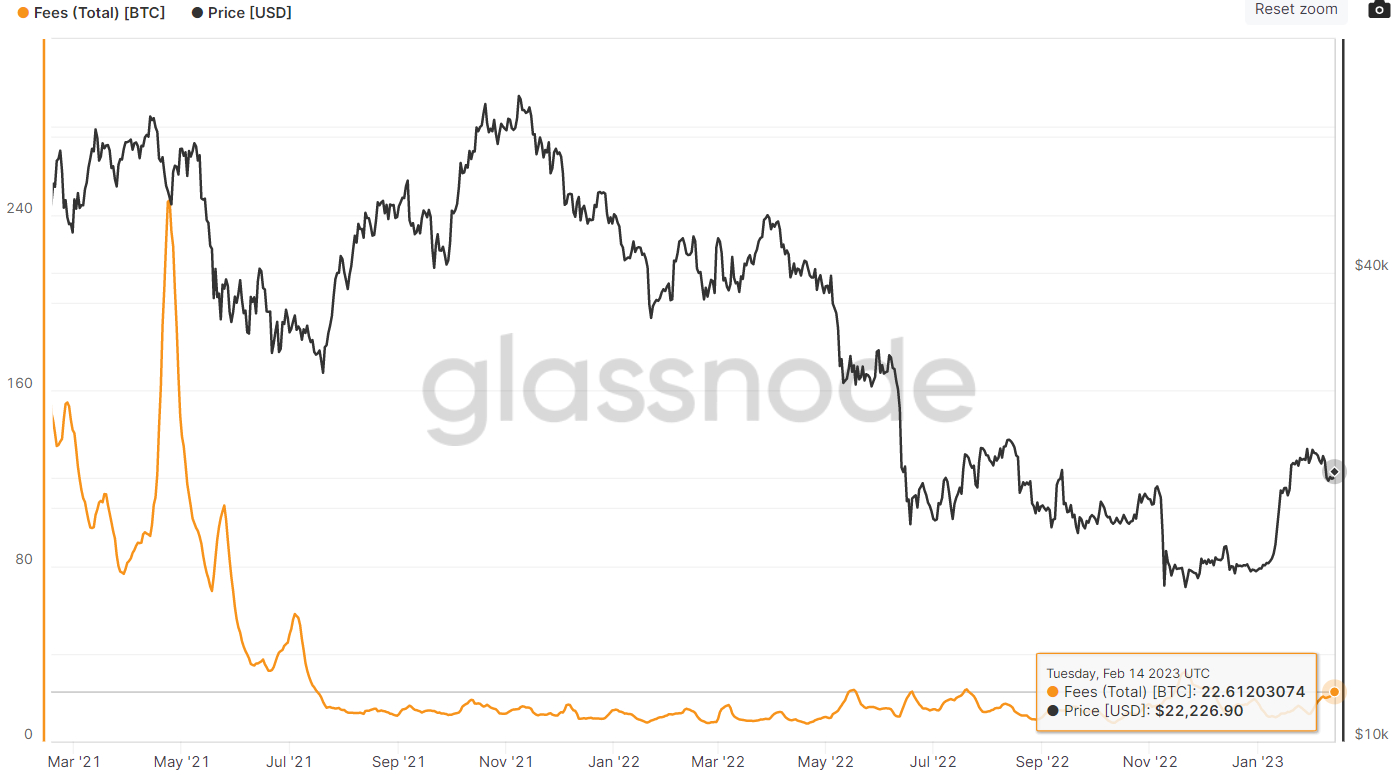
On Tuesday, the seven-day moving average of this fee just reached its highest since early December 2022 at 22.6 BTC. That is substantially above the 365-day moving average of only around 15 BTC. And this uptick in fees is different to the uptick seen in Q4 last year. Last year, Bitcoin owners were scrambling to get their BTC off exchanges in wake of the FTX collapse. The fee uptick coincided with a short-lived rise in network activity and a decline in the BTC price.
This time, the uptick in BTC fee revenues coincides with a rise in Bitcoin’s price since the beginning of the year. According to Glassnode, “a sustained uptick in fee revenue as a proportion of the total reward indicates that Bitcoin blocks are full, and there is growing demand for transaction activity”. “Given the constrained block size of Bitcoin, this has historically provided a valuable early indicator of a macro trend shift in the network demand profile,” they add.

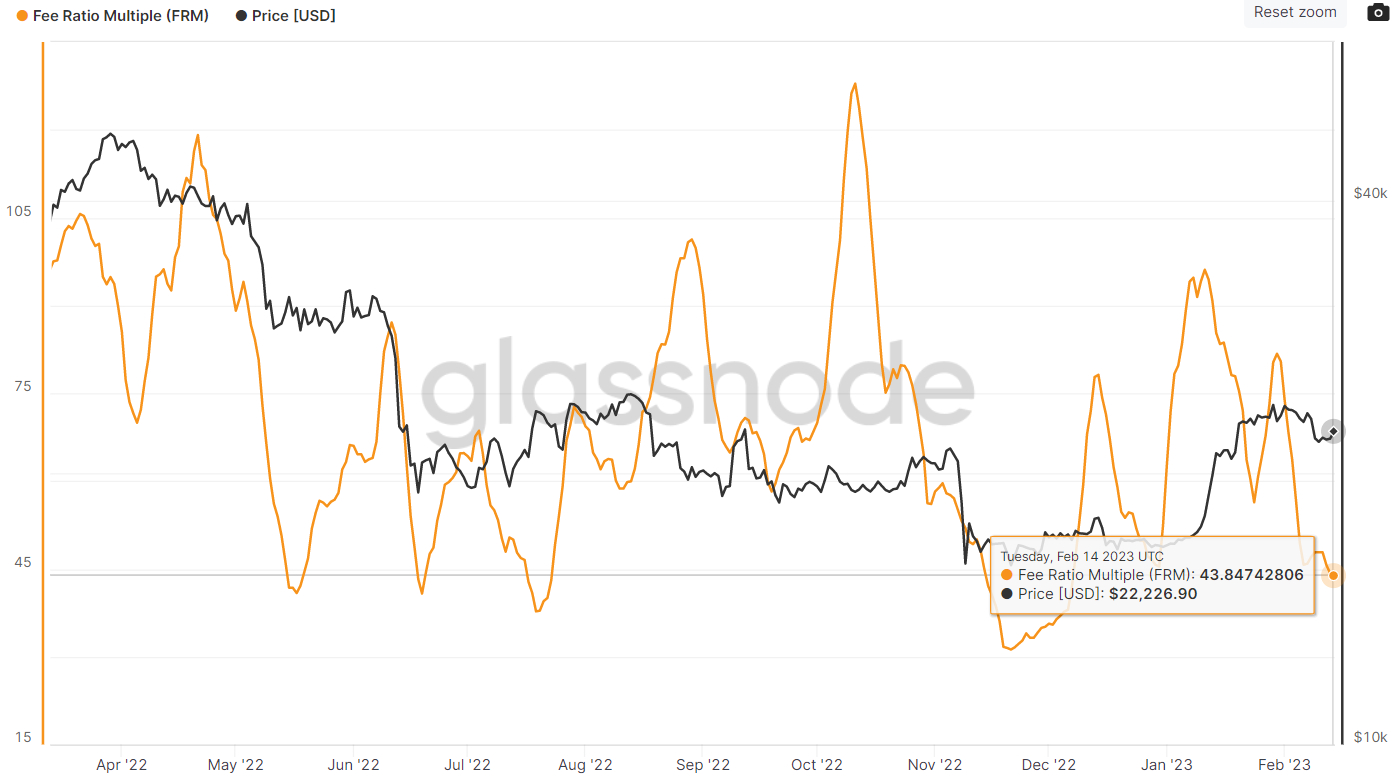
The rise in the BTC-denominated seven-day moving average of daily Bitcoin network fees coincides with a fall in Glassnode’s Bitcoin Fee Ratio Multiple. This multiple is calculated by dividing total miner revenue (which includes newly minted BTC) by daily network fees. When this multiple goes lower, it means a higher percentage of Bitcoin miner revenue is coming from network fees. The seven-day Bitcoin Fee Revenue Multiple was last around 43.8 on Tuesday, its lowest since early December 2022 and well below its 365-day moving average of around 70.

Fee Revenue Momentum About to Send Bullish Signal for BTC?
The uptick in BTC-denominated Bitcoin network fees means that an important indicator tracked by analysts at Glassnode might be about to turn positive and send its first bullish signal for the Bitcoin market since 2021 (excluding a short-lived false signal it sent last November). To give some context first, Glassnode has a popular dashboard that it uses to gauge when Bitcoin might be staging a recovery from a bear market called “Recovering from a Bitcoin Bear”.
The dashboard monitors eight on-chain and technical metrics. Two look at whether Bitcoin is trading above key pricing models (the 200DMA and Realized Price). Two look at whether market profitability is returning. Two look at whether the balance of USD wealth has shifted sufficiently in favor of longer-term HODLers. The final two look at whether momentum on the Bitcoin network has shifted in a positive direction.
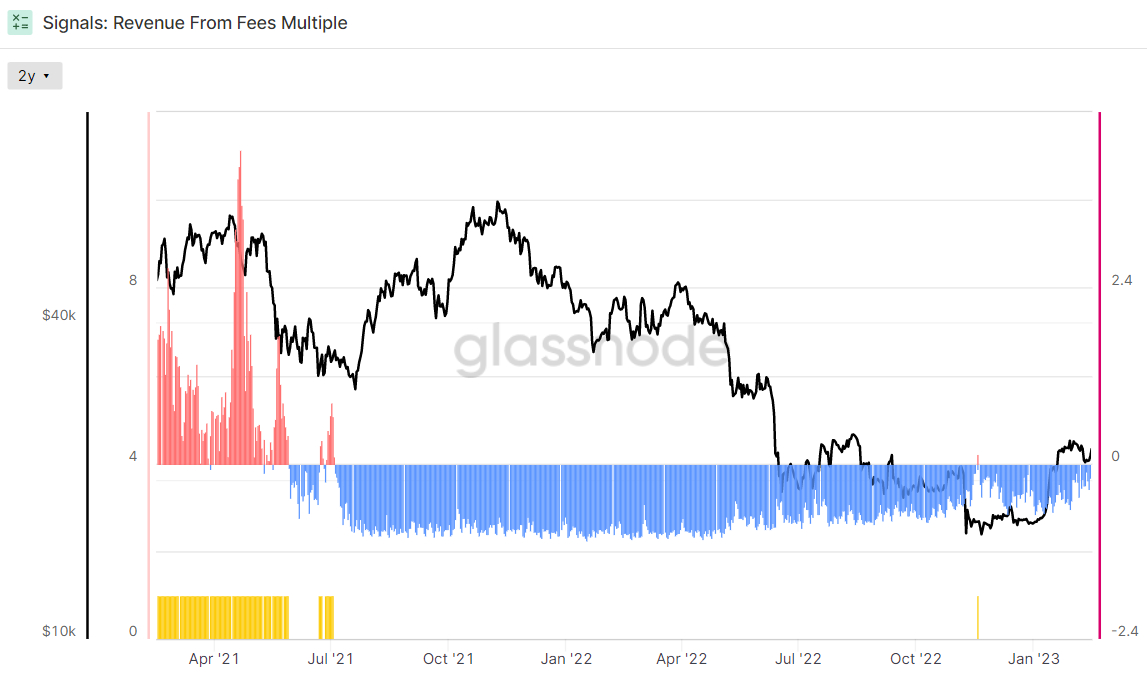
Seven of these eight metrics are all flashing bullish signals that the Bitcoin bear market of 2022 might be over, as discussed in a recent article. The only metric not flashing a bullish signal is Glassnode’s 2-year Z-score of the Revenue Fee Multiple – to do this, the 2-year Z-score needs to turn positive. For reference, the 2-year Z-score is the number of standard deviations above or below the mean of the last two years’ worth of data.

However, amid the recent rise in BTC-denominated network fees that has driven a fall in the Fee Revenue Multiple, the Z-score is getting very close to zero and might soon turn positive, thus become the eighth out of Glassnode’s eight metrics to flash green. The Z-score has been trending higher since the start of the year and was last around -0.15.
What This Means for BTC?
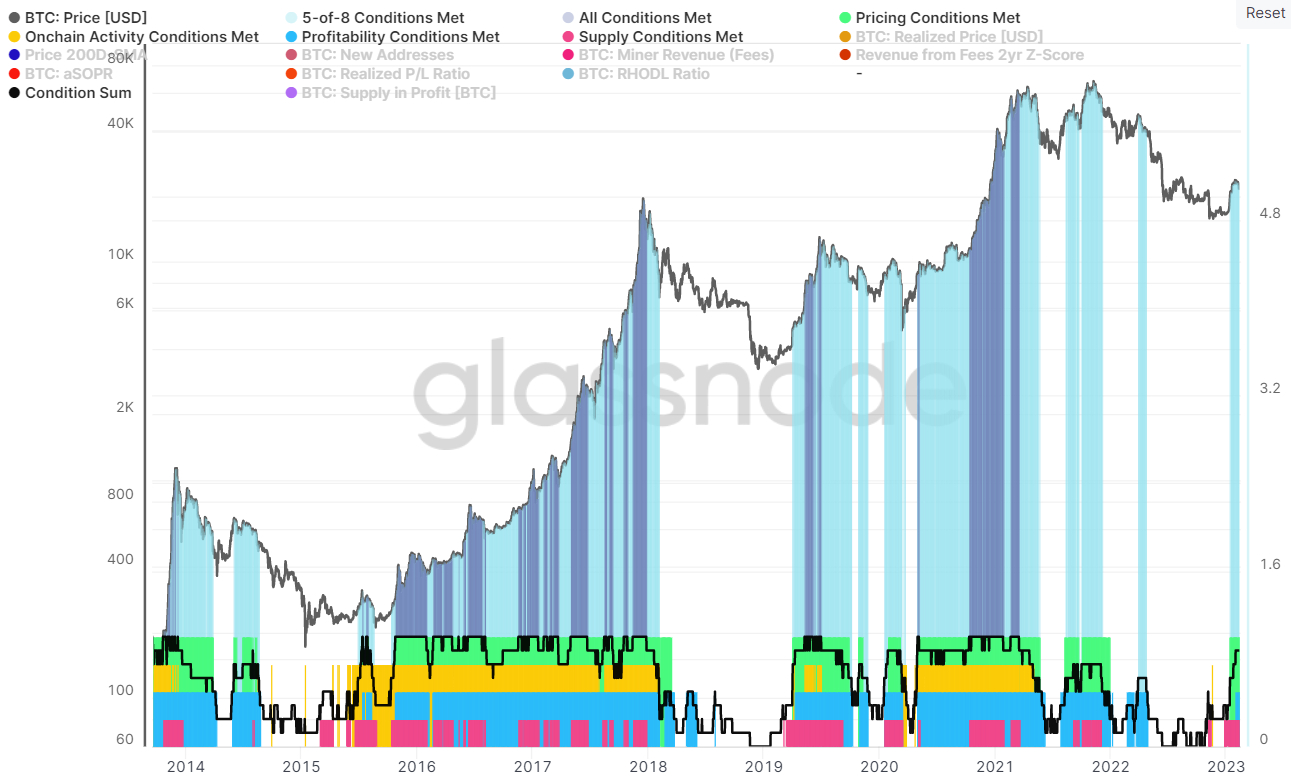
If the 2-year Z-score of the Bitcoin Revenue Fee Multiple turns positive, all eight of Glassnode’s “Recovering from a Bitcoin Bear” dashboard indicators will be flashing green in unison for the first time in nearly two years. When the dashboard switches from less than eight of its indicators flashing green to all eight, this doesn’t itself mean anything for the Bitcoin price. As the graphic below demonstrates, during a Bitcoin bull market, it is common to see the dashboard switching between eight and less than eight indicators flashing green.

What is more meaningful here is when you consider the moment when all eight of the indicators of the dashboard start flashing green for the first time after a prolonged Bitcoin bear market. The last time this happened was during October 2020, when Bitcoin was trading around $11,500. By April 2021, Bitcoin had surged into the $63,000s. Prior to October 2020, all eight indicators hadn’t been flashing green since July 2019, aside from a brief period in April 2020.
Other examples of when all eight indicators started flashing green for the first time in a long time following a prolonged Bitcoin bear market include in May 2019 and in October 2015. All of these past aforementioned instances represent excellent moments to have bought Bitcoin. If all eight of Glassnode’s Recovering from a Bitcoin Bear indicators start flashing green, as soon may be likely, analysts might thus interpret this as a signal that Bitcoin’s risk-reward at current price levels is very good indeed.
The miners who power the Bitcoin network, and are still largely incentivized to do so via the printing of new BTC tokens, are benefitting from an uptick in daily network fees, according to data provided by crypto analytics firm Glassnode. At present the Bitcoin network rewards its miners with 6.25 Bitcoins for every block that it mined (about every 10 minutes), though the Bitcoin network also charges a small fee for transactions, which also goes towards miners.

On Tuesday, the seven-day moving average of this fee just reached its highest since early December 2022 at 22.6 BTC. That is substantially above the 365-day moving average of only around 15 BTC. And this uptick in fees is different to the uptick seen in Q4 last year. Last year, Bitcoin owners were scrambling to get their BTC off exchanges in wake of the FTX collapse. The fee uptick coincided with a short-lived rise in network activity and a decline in the BTC price.
This time, the uptick in BTC fee revenues coincides with a rise in Bitcoin’s price since the beginning of the year. According to Glassnode, “a sustained uptick in fee revenue as a proportion of the total reward indicates that Bitcoin blocks are full, and there is growing demand for transaction activity”. “Given the constrained block size of Bitcoin, this has historically provided a valuable early indicator of a macro trend shift in the network demand profile,” they add.

The rise in the BTC-denominated seven-day moving average of daily Bitcoin network fees coincides with a fall in Glassnode’s Bitcoin Fee Ratio Multiple. This multiple is calculated by dividing total miner revenue (which includes newly minted BTC) by daily network fees. When this multiple goes lower, it means a higher percentage of Bitcoin miner revenue is coming from network fees. The seven-day Bitcoin Fee Revenue Multiple was last around 43.8 on Tuesday, its lowest since early December 2022 and well below its 365-day moving average of around 70.

Fee Revenue Momentum About to Send Bullish Signal for BTC?
The uptick in BTC-denominated Bitcoin network fees means that an important indicator tracked by analysts at Glassnode might be about to turn positive and send its first bullish signal for the Bitcoin market since 2021 (excluding a short-lived false signal it sent last November). To give some context first, Glassnode has a popular dashboard that it uses to gauge when Bitcoin might be staging a recovery from a bear market called “Recovering from a Bitcoin Bear”.
The dashboard monitors eight on-chain and technical metrics. Two look at whether Bitcoin is trading above key pricing models (the 200DMA and Realized Price). Two look at whether market profitability is returning. Two look at whether the balance of USD wealth has shifted sufficiently in favor of longer-term HODLers. The final two look at whether momentum on the Bitcoin network has shifted in a positive direction.
Seven of these eight metrics are all flashing bullish signals that the Bitcoin bear market of 2022 might be over, as discussed in a recent article. The only metric not flashing a bullish signal is Glassnode’s 2-year Z-score of the Revenue Fee Multiple – to do this, the 2-year Z-score needs to turn positive. For reference, the 2-year Z-score is the number of standard deviations above or below the mean of the last two years’ worth of data.

However, amid the recent rise in BTC-denominated network fees that has driven a fall in the Fee Revenue Multiple, the Z-score is getting very close to zero and might soon turn positive, thus become the eighth out of Glassnode’s eight metrics to flash green. The Z-score has been trending higher since the start of the year and was last around -0.15.
What This Means for BTC?
If the 2-year Z-score of the Bitcoin Revenue Fee Multiple turns positive, all eight of Glassnode’s “Recovering from a Bitcoin Bear” dashboard indicators will be flashing green in unison for the first time in nearly two years. When the dashboard switches from less than eight of its indicators flashing green to all eight, this doesn’t itself mean anything for the Bitcoin price. As the graphic below demonstrates, during a Bitcoin bull market, it is common to see the dashboard switching between eight and less than eight indicators flashing green.

What is more meaningful here is when you consider the moment when all eight of the indicators of the dashboard start flashing green for the first time after a prolonged Bitcoin bear market. The last time this happened was during October 2020, when Bitcoin was trading around $11,500. By April 2021, Bitcoin had surged into the $63,000s. Prior to October 2020, all eight indicators hadn’t been flashing green since July 2019, aside from a brief period in April 2020.
Other examples of when all eight indicators started flashing green for the first time in a long time following a prolonged Bitcoin bear market include in May 2019 and in October 2015. All of these past aforementioned instances represent excellent moments to have bought Bitcoin. If all eight of Glassnode’s Recovering from a Bitcoin Bear indicators start flashing green, as soon may be likely, analysts might thus interpret this as a signal that Bitcoin’s risk-reward at current price levels is very good indeed.