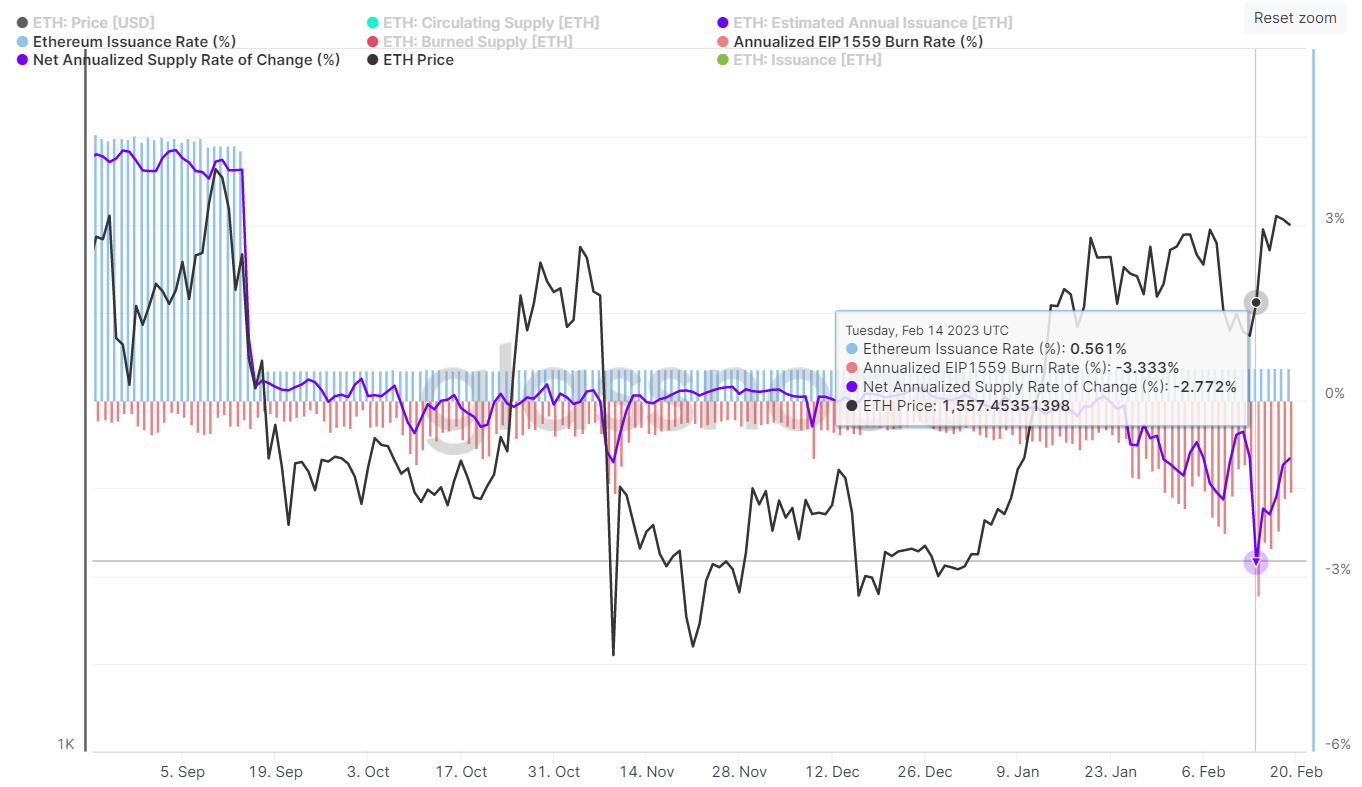
The annualized daily net inflation rate of the Ether (ETH) supply hit a record low of -2.772% last Tuesday, according to data supplied by crypto analytics firm Glassnode. Ether is the token that power’s the smart-contract-enabled Ethereum blockchain, which is currently the world’s dominant blockchain in terms of the size of its associated ecosystem of decentralized applications. Ether is the second-largest cryptocurrency by market capitalization.

Ether’s net inflation rate has since risen to around -1% as of Sunday. But there has been a clear trend over the course of the last month. The rate at which the Ether supply is falling, or deflating at, is accelerating. And if current trends activity in the Ethereum network continue, that deflation rate could further accelerate, a trend many analysts think would be bullish for the ETH price.
How Higher Gas Fees Drive Faster ETH Deflation
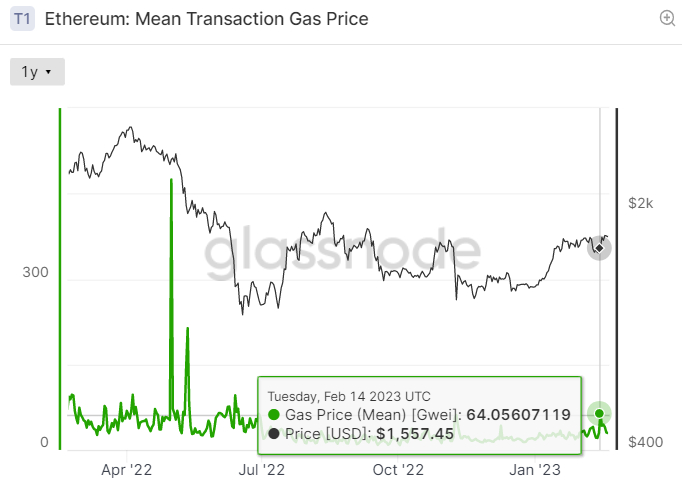
According to Glassnode, the gas price on the Ethereum network hit a seven-month high of 64 Gwei. 1 Gwei is equal to 0.000000001 ETH. The minimum gas fee (denominated in Gwei) that a user needs to pay for a transaction is calculated by multiplying the Gwei Gas Price by the Gas Limit, which is currently 21,000.

That means that, last Tuesday, when the gas price hit 64 Gwei, users had to pay a minimum of 1,344,000 Gwei, or 0.001344 ETH per transaction. That’s roughly $2.10 based on Ether’s closing price last Tuesday. By Sunday, the gas price had fallen to around 30 Gwei, meaning a transaction fee of 0.00063 ETH, roughly $1.06 based on Sunday’s closing Ether price.
A rising gas price (as represented by a rise in Gwei) is directly related to the rate at which the Ether supply is burned. Before understanding why, we must quickly understand how the Ethereum network fee structure works. Network fees are split into two components. The first is a base fee that all users must pay to ensure that their transaction is accepted and processed on the blockchain.
There is then an optional tip that users can pay to have their transaction processed more quickly. The Ethereum network automatically calculates the base fee, which rises at times of heavy network traffic. Ethereum Improvement Proposal (EIP) 1559, which was implemented into the Ethereum code in the London hardfork in August 2021, requires that all of these base fees paid by users are then burned, removing the tokens from circulation permanently.
As a result, when the base gas fee rises, the rate at which Ether is burned also rises. This can be seen in the above chart – the red bars represent the ETH burn rate as a result of EIP 1559. When this burn rate exceeds the issuance ETH rate, which is around 0.55%, the ETH supply will decline. ETH is issued to the nodes and stakers that secure the Ethereum network.
The ETH Deflation Rate Could Accelerate Further
There are signs that activity on the Ethereum network have been rising this year, and this could continue, creating further upwards pressure on gas fees and thus further increasing the ETH burn rate. According to DeFi Llama, the total amount of capital locked within smart contracts on the Ethereum network, or trade value locked (TVL), was last around $54 billion, up from around $35 billion since the start of the year.
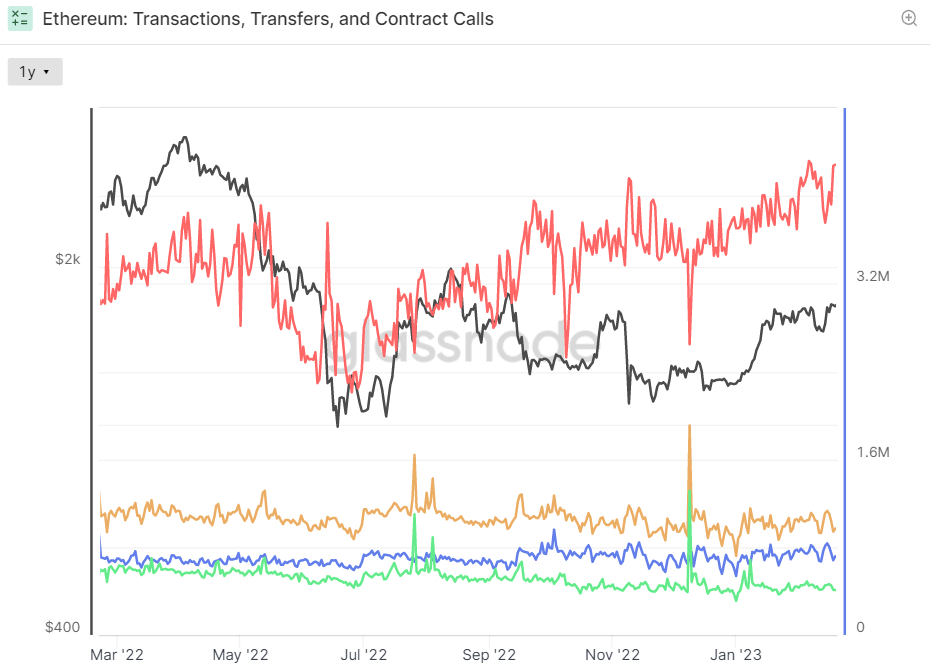
This can be partially explained by the rise in crypto prices. But ETH-denominated TVL is up to around 32.3 million from 31 million at the start of the year. Meanwhile, though the number and volume of ETH transactions on the Ethereum network has been pretty much stagnant over the course of the last year, the number of so-called internal smart contract calls (calls initiated from within an already executed smart contract), have been trending higher in recent months, indicating increasing network smart contract activity.

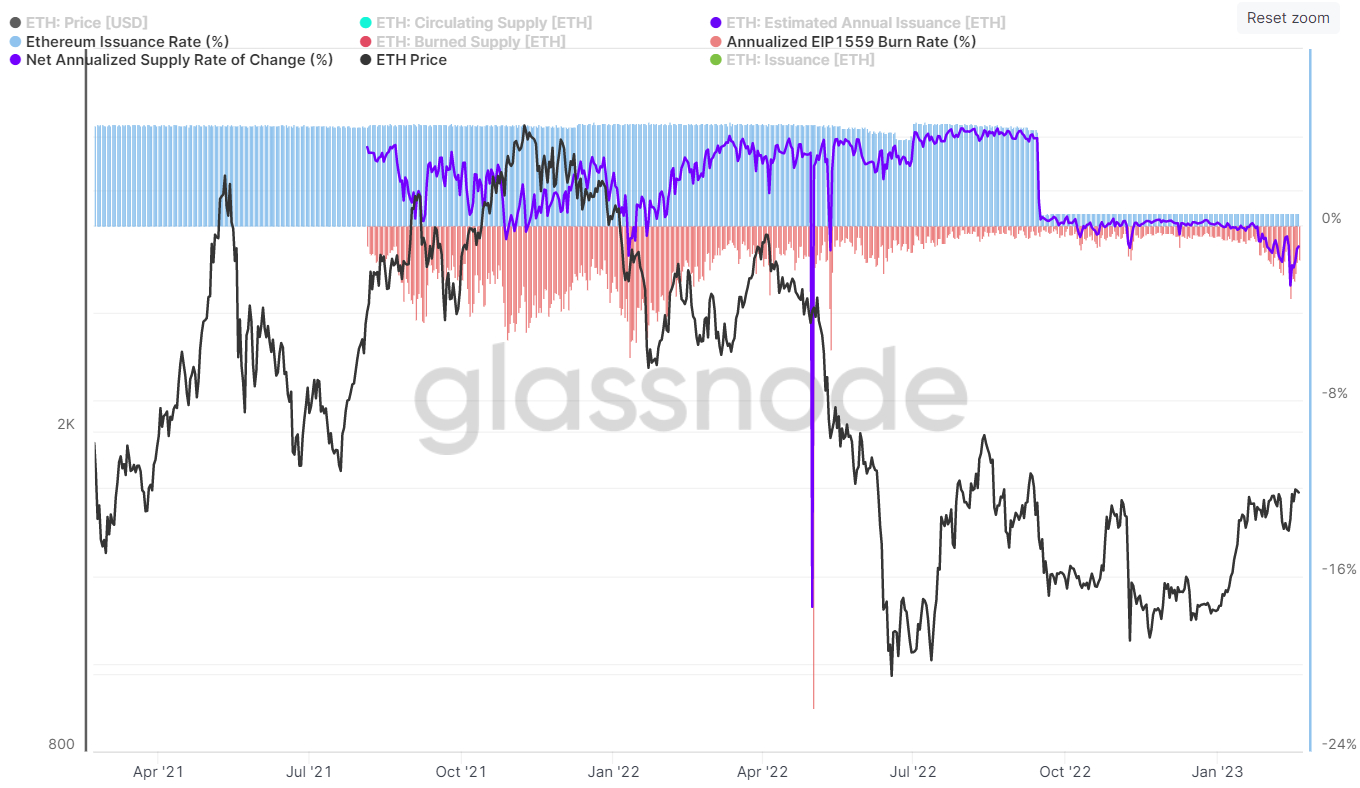
Ether is up around 42% on the year, and if crypto prices continue to rise, Ethereum network activity levels can be expected to continue rising, as investors dive back into Decentralized Finance (DeFi) amid improved market sentiment. High network congestion drove the daily annualized ETH (EIP 1559) burn rate as high as 6.0% in early 2022.

At the time, the Ethereum blockchain was still powered by the much more energy-intensive proof-of-work consensus mechanism and, as a result of the much higher energy fees and miner rig costs incurred by the miners that powered the network, Ethereum’s issuance rate was much higher at around 4.4-4.6% per year. That means that Ether’s deflation rate only hit a maximum of around 1.5%.
But if the EIP 1559 burn rate returns to its early 2022 highs, Ether’s deflation rate could hit a staggering 5.5%. It’s impossible to predict the future path of Ethereum network gas fees and the ETH burn rate. But one thing is for sure, the fact that ETH is a deflationary asset should underpin its price performance in the coming years. With DeFi adoption set to accelerate and the Bitcoin supply still inflating at around 2% per year (until the next halving in around a year and a half), many analysts think ETH has a good chance of catching or even surpassing BTC in terms of market capitalization.
The annualized daily net inflation rate of the Ether (ETH) supply hit a record low of -2.772% last Tuesday, according to data supplied by crypto analytics firm Glassnode. Ether is the token that power’s the smart-contract-enabled Ethereum blockchain, which is currently the world’s dominant blockchain in terms of the size of its associated ecosystem of decentralized applications. Ether is the second-largest cryptocurrency by market capitalization.

Ether’s net inflation rate has since risen to around -1% as of Sunday. But there has been a clear trend over the course of the last month. The rate at which the Ether supply is falling, or deflating at, is accelerating. And if current trends activity in the Ethereum network continue, that deflation rate could further accelerate, a trend many analysts think would be bullish for the ETH price.
How Higher Gas Fees Drive Faster ETH Deflation
According to Glassnode, the gas price on the Ethereum network hit a seven-month high of 64 Gwei. 1 Gwei is equal to 0.000000001 ETH. The minimum gas fee (denominated in Gwei) that a user needs to pay for a transaction is calculated by multiplying the Gwei Gas Price by the Gas Limit, which is currently 21,000.

That means that, last Tuesday, when the gas price hit 64 Gwei, users had to pay a minimum of 1,344,000 Gwei, or 0.001344 ETH per transaction. That’s roughly $2.10 based on Ether’s closing price last Tuesday. By Sunday, the gas price had fallen to around 30 Gwei, meaning a transaction fee of 0.00063 ETH, roughly $1.06 based on Sunday’s closing Ether price.
A rising gas price (as represented by a rise in Gwei) is directly related to the rate at which the Ether supply is burned. Before understanding why, we must quickly understand how the Ethereum network fee structure works. Network fees are split into two components. The first is a base fee that all users must pay to ensure that their transaction is accepted and processed on the blockchain.
There is then an optional tip that users can pay to have their transaction processed more quickly. The Ethereum network automatically calculates the base fee, which rises at times of heavy network traffic. Ethereum Improvement Proposal (EIP) 1559, which was implemented into the Ethereum code in the London hardfork in August 2021, requires that all of these base fees paid by users are then burned, removing the tokens from circulation permanently.
As a result, when the base gas fee rises, the rate at which Ether is burned also rises. This can be seen in the above chart – the red bars represent the ETH burn rate as a result of EIP 1559. When this burn rate exceeds the issuance ETH rate, which is around 0.55%, the ETH supply will decline. ETH is issued to the nodes and stakers that secure the Ethereum network.
The ETH Deflation Rate Could Accelerate Further
There are signs that activity on the Ethereum network have been rising this year, and this could continue, creating further upwards pressure on gas fees and thus further increasing the ETH burn rate. According to DeFi Llama, the total amount of capital locked within smart contracts on the Ethereum network, or trade value locked (TVL), was last around $54 billion, up from around $35 billion since the start of the year.
This can be partially explained by the rise in crypto prices. But ETH-denominated TVL is up to around 32.3 million from 31 million at the start of the year. Meanwhile, though the number and volume of ETH transactions on the Ethereum network has been pretty much stagnant over the course of the last year, the number of so-called internal smart contract calls (calls initiated from within an already executed smart contract), have been trending higher in recent months, indicating increasing network smart contract activity.

Ether is up around 42% on the year, and if crypto prices continue to rise, Ethereum network activity levels can be expected to continue rising, as investors dive back into Decentralized Finance (DeFi) amid improved market sentiment. High network congestion drove the daily annualized ETH (EIP 1559) burn rate as high as 6.0% in early 2022.

At the time, the Ethereum blockchain was still powered by the much more energy-intensive proof-of-work consensus mechanism and, as a result of the much higher energy fees and miner rig costs incurred by the miners that powered the network, Ethereum’s issuance rate was much higher at around 4.4-4.6% per year. That means that Ether’s deflation rate only hit a maximum of around 1.5%.
But if the EIP 1559 burn rate returns to its early 2022 highs, Ether’s deflation rate could hit a staggering 5.5%. It’s impossible to predict the future path of Ethereum network gas fees and the ETH burn rate. But one thing is for sure, the fact that ETH is a deflationary asset should underpin its price performance in the coming years. With DeFi adoption set to accelerate and the Bitcoin supply still inflating at around 2% per year (until the next halving in around a year and a half), many analysts think ETH has a good chance of catching or even surpassing BTC in terms of market capitalization.